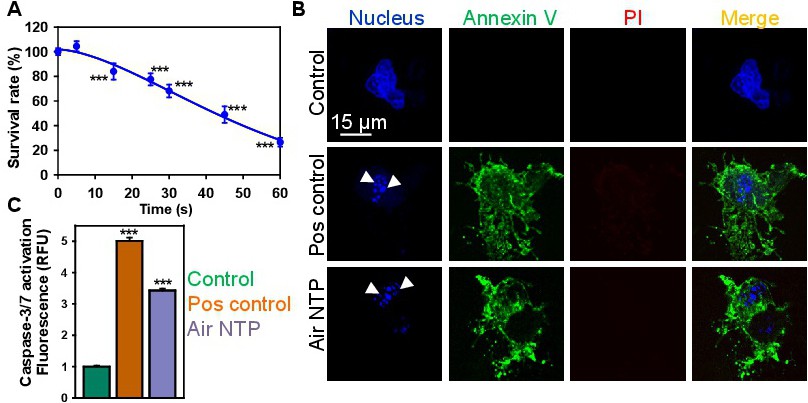
Fig. 8. NTP treatment results in apoptosis of Alexander cells. (A) Analysis of cytotoxicity in Alexander cells treated with NTP. Cell viability was analysed by WST-1 assay 24 h post plasma treatment. The data were normalized to control values (no exposure), which were set as 100 % cell viability. Readings were done in quadruplicates, data are present as mean ± SEM, n=3 (three independent experiments). One-way ANOVA with Newman-Keuls multiple comparison test was used; t=0 time point serving as control; ***P< 0.001. (B) Alexander cells were treated with NTP for 60 s and then 6 h after the treatment labelled with NucRed nuclear stain (blue), annexin V (green) and PI (red). Cells treated with 2 µM staurosporine for 4 h served as a positive control. Labelled cells were imaged with confocal microscopy. Representative images out of three independent experiments are shown. White arrows indicate fragmented nuclei. (C) Caspase-3/7 activation assay in Alexander cells. Alexander cells were treated with NTP for 60 s and then 6 h after the treatment cells were labelled CellEvent(tm) Caspase-3/7 Green Assay Kit. Following staining, cells were analysed using a fluorescent microplate reader. Readings were done in quadruplicates. As a positive control, cells were treated with 2 µM staurosporine for 4 h. The data present the mean values of four independent experiments. Data are expressed as means ± SEM (n = 4); ***P< 0.001.